Statistics
The Statistics snap-in allows you to view detailed statistics about your Trust Protection Foundation server's activity and performance.
DID YOU KNOW? The Statistics is also available as a node in the CyberArk Configuration Console. Whereas the CyberArk Configuration Console requires you to be logged in to the Trust Protection Foundation server, the MMC snap-in can be run from any Windows machine.
The content in this topic applies to both the CyberArk Configuration Console node and the MMC snap-in.
Granting access to the Statistics Snap-In
To use the Statistics, users must be given access by an administrator.
- Sign in to the Trust Protection Foundation, and click API > Integrations in the menu bar.
- Click Statistics.
- Click User or team access.
- In the User or team box, enter the name of the user or team you want to grant access to.
- Click Add.
- Click Save.
Once users have access, they can install and configure the snap-in.
Installing the Statistics Snap-In
The Statistics is included as part of the Trust Protection Foundation MMC Snap-In Collection. For installation instructions, see Install the Trust Protection Foundation MMC Snap-In Collection.
NOTE If you're using the Statistics node in VCC, no installation is needed. Just open VCC and click the Statistics node.
Using the Statistics Snap-In
Viewing statistics
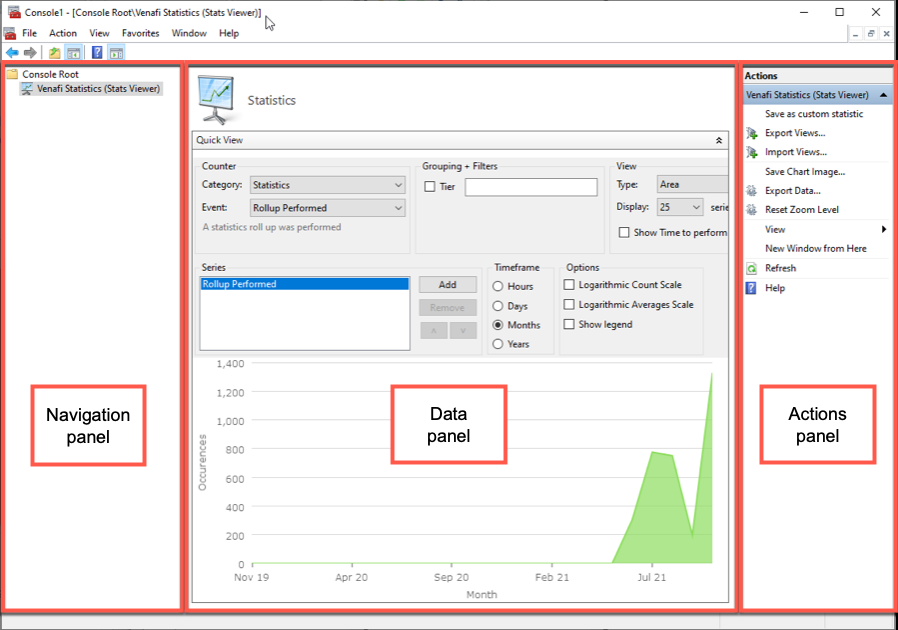
To view statistics, click CyberArk Statistics in the navigation panel. In the data panel, the Statistics interface opens.
The top of the data panel provides various statistics options to select from, and the associated data will be displayed in the graph area at the bottom of the panel.
In the Counter box, use the Category and Event drop-downs to select what statistics to view. You can further refine the statistics report by using the options in the Grouping + Filters, View, Timeframe, and Options sections.
TIP Hovering over the graph shows specific values behind the graph elements.
Clicking and dragging on the graph expands the highlighted selection. This is useful to get a more granular view of the graph data. To zoom out, click Reset Zoom Level in the Actions panel.
Overlaying multiple statistics graphs
The Series box allows you to select multiple statistics and overlay them in the graph area. To add additional statistics to your current view, click Add. This adds an additional series, independent from all other series already defined. You can now select the statistics that you want this series to show.
The order of the series determines how the various graphs get stacked in the graph area. You can adjust the order using the up and down arrow buttons.
In this example, we'll view the total number of successful code signing operations and the average time to sign on the same graph.
First, from the Counter drop-downs, select the Code Signing category and the Signing Successful event. In the View box, select Column for the type, and from the Timeframe box, select Months. The graph now shows a bar graph with the total number of successful signing operations per month.
Next, click Add in the Series box. This adds a new series.
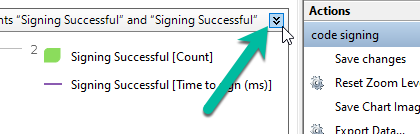
For this series, select Code Signing and Signing Successful again from the Counter drop-downs. Then, in the View box, click the Show Time to sign checkbox. A line with the average signing time per month is overlayed on top of the chart.
Saving a statistics view
To save a particular statistics view, click Save as custom statistic in the Actions panel on the right. Then provide a name and location to save your view. Once saved, the view is available in the left navigation panel.
NOTE Saved views are saved to your Trust Protection Foundation user preferences. As such, saved views are available on any system where you use the snap-in against the same Trust Protection Foundation server using the same user credentials.
Editing a saved statistics view
To edit a saved view, open the view from the navigation panel. If the statistic selections aren't showing at the top of the data panel, click the expand icon in the top right corner of the data panel.
After making changes, click Save changes in the Actions panel.
Options available from the Actions panel
| Option | Description |
|---|---|
| Save as custom statistic |
Saves the current statistics view to the user's Trust Protection Foundation profile. It is available from the navigation panel. After saving, this view is available from any machine where the snap-in is added against the same Trust Protection Foundation server using the same credentials. This option shows only for views that haven't previously been saved. |
| Save changes | Saves any changes to a previously-saved view. |
| Export Views |
Exports view parameters to a JSON file. This file can then be imported using the Import Views action on another machine. TIP This feature is best used for sharing views with other users, or for copying views from one environment to another (such as from dev to production). If you just want to make this same view available to yourself from another machine, use the Save as custom statistic action instead (see above for details). |
| Import Views | Imports JSON files that were created using the Export Views action. During import, you can select where you want this view saved in the navigation panel. |
| Save Chart Image | Saves an image of the current graph as a PNG file. Selecting the Show legend checkbox includes a graph legend as part of the image file. |
| Export Data | Exports the data to a CSV file. |
| Reset Zoom Level | Resets the zoom level back to the default if you've zoomed in on the graph. You can zoom in by clicking and dragging to highlight a specific section of the graph. |
There are some events in the Platform category and the Framework category that are only available if you give the operational database account additional permissions in MSSQL Server, as described in the next section.
For information about using WebSDK for statistics reporting, see POST Stats/Query.
Permissions for enhanced performance and scalability monitoring
In large deployments where you need to closely monitor performance and scalability, you can give the operational database account additional permissions in MSSQL Server. These permissions are optional, and are only recommended if you have a dedicated SQL server for CyberArk Trust Protection Foundation - Self-Hosted, because these permissions could give CyberArk Trust Protection Foundation - Self-Hosted the ability to query some limited details about other databases on the server.
IMPORTANT CyberArk Trust Protection Foundation - Self-Hosted does not collect any information about other databases on the server. However, because it is possible, we don't recommend you make these changes on shared database servers.
Granting Database Owner (DBO) permissions in Trust Protection Foundation is safe because Trust Protection Foundation is a single-user environment. In multi-user environments, DBO permissions can be risky as they allow one user to modify others’ data. However, in Trust Protection Foundation, only Trust Protection Foundation services access the database, so DBO permissions don’t pose a risk to other users or databases on the same SQL server.
Giving the operational database account these permissions will allow CyberArk Trust Protection Foundation - Self-Hosted administrators to have readily available performance data on the CyberArk Trust Protection Foundation - Self-Hosted database, viewable in the Statistics MMC snap-in.
Giving enhanced reporting permissions in MSSQL
- Log in to the database server with the database owner account.
- In the Object Explorer, right-click on the database server container, then click Properties.
- In the Page panel, click Permissions.
- In the Logins or roles panel, click the name of the operational database account.
-
In the Explicit tab, click the Grant checkbox for the following permissions:
- View any definition
- View server state
- Click OK.